Tag Archives: stock market blog

UK: FTSE: Further gains seen in coming days!


Market Commentary:

ftse100Yesterday saw another jump in price action that took the price well above last 6300 levels. Index finished higher by 176 points towards the close.

The strong recovery over the past three days has brought the price closer to the top of Thursdays black candle formation. Some amount of selling might prevail at these levels. The daily momentum studies that were seen slipping have turned direction up from mid range in line with price action. Price back above the 21, 50 and 200 days moving average is also a positive indicator for trend. To conclude the price chart and momentum indicators are conducive for further gains in the coming days.

Risk Warning

This does not constitute or form part of any offer for sale or subscription or solicitation of any offer to buy or subscribe for any shares nor shall it or any part of it form the basis or be relied on in connection with any contract or commitment whatsoever. Please note that William Albert Securities Limited does not enter into any form of contract by means of internet. William Albert Securities Limited (FCA 230691) is authorised and regulated, in the UK, by the Financial Conduct Authority (FCA).

 

Tagged , , , , , , , ,

Bears and Bulls Struggling on a Global Scale


Germany – DAX (9331) Target (9475)

DAX closed with a gain of 163 points yesterday.  Bears are hitting hard and Bulls are trying to save the market.  This is visible by the volatility around the 9300 neckline support.  Candlestick chart shows the formation of a “Bullish Harami” pattern.  Both Bulls and Bears have their respective supporting points which remain unchanged:

Points in favour of Bulls:

  • Daily MACD is in buy mode
  • Rise after 5th wave completion
  • Upward gap remain unfilled
  • Rally after positive divergence in oscillator
  • Bounce back from lower end support channel.
  • Formation of “Harami” (added strength)

Points in favour or Bears:

  • Daily stochastic down tick at overbought zone
  • Major trend remains down

France – CAC (4248) Target (4300)

CAC closed with a gain of 93 points yesterday.  This was a huge gap up opening and close above the high of Wednesday’s trade.  Strong tussle is going on between Bulls and Bears.  Bears are hitting hard and bulls are trying to save the market.  Nerve shaking volatility from the last 5-6 days clearly shows that.  Different technical parameters support Bulls and Bears at different places.  Volatility may continue till a trend is established, either a rise above 4300 or a fall below 4100 will determine the trend.

UK – FTSE 100 (6043.5) Target (5350)

Trend inched further higher yesterday after opening on a flat note.  Index finished higher by 80 points towards the close.  A hammer candlestick chart followed by  a long green candle is a bullish occurrence.  In momentum studies the fast stochastic has now reached overbought position and is now close to giving a sell signal soon.  The RSI (14) and MACD indicator however continues to trade around mid-range in line with price action.  The intermediate trend however stands bearish as price continues to make lower top lower bottom formation.  Hence unless we have 6125 taken off convincingly the technical situation remains weak.  Immediate hurdle comes at 6050 followed by major hurdle at 6125.  Support comes at 5495 breach witch the fall might extend towards 5170.

India – NIFTY (6970) Target (7075)

Market continued to remain under pressure for the third consecutive day.  Nifty traded in red for the entire day yesterday and fell to a low of 6961 closing at 6970 with a loss of 48 points.

Needless to say, Bears are in total control:

  • Major trend is down
  • Daily MACD has generated a sell signal again
  • Index below all major moving averages

It remains a sell.  However, looking to positive move in US and European markets yesterday, a gap opening is expected and Nifty may trade in positive today.

Relief for Bulls:

  • Positive divergence in oscillators
  • Lower end of falling channel

What is a ‘Bullish Harami’

A bullish harami is a candlestick chart pattern in which a large candlestick is followed by a smaller candlestick whose body is located within the vertical range of the larger body. In terms of candlestick colors, the bullish harami is a downtrend of negative-colored (black) candlesticks engulfing a small positive (white) candlestick, giving a sign of a reversal of the downward trend.

Read more: Bullish Harami Definition | Investopedia http://www.investopedia.com/terms/b/bullishharami.asp#ixzz41GREwkLO 

Risk Warning
This does not constitute or form part of any offer for sale or subscription or solicitation of any offer to buy or subscribe for any shares nor shall it or any part of it form the basis or be relied on in connection with any contract or commitment whatsoever. Please note that William Albert Securities Limited does not enter into any form of contract by means of internet. William Albert Securities Limited (FCA 230691) is authorised and regulated, in the UK, by the Financial Conduct Authority (FCA).
Tagged , , , , , , , ,

Rentokil Initial Trading Above Mid-Range


FTSE 100 – Rentokil Initial (168.57) Target (200)

Trend has broken out from prior resistance top at 163 followed by reversal of action to the up during the past two trading days.  The daily momentum studies are also positive with major indicators trading higher above mid-range.  On trading above 150 the target comes first at 175 and thereafter at 200.

Rentokil Initial plc provides fully integrated facilities management and essential support services to government and commercial sector organisations of all sizes across all business sectors. The Company provides services in pest control, hygiene, workwear, facilities and plants.

  • Open – 167.4
  • Day Range – 165.9-168.3
  • 52WK Range – 132.2-170.5
  • Market Cap (B GBP) – 3.033
  • Shares Outstanding (B) – 1.823
  • Sector – Consumer Discretionary
  • Industry – Commercial Services
  • Sub-industry – Building Maintenance Services
Risk Warning
This does not constitute or form part of any offer for sale or subscription or solicitation of any offer to buy or subscribe for any shares nor shall it or any part of it form the basis or be relied on in connection with any contract or commitment whatsoever. Please note that William Albert Securities Limited does not enter into any form of contract by means of internet. William Albert Securities Limited (FCA 230691) is authorised and regulated, in the UK, by the Financial Conduct Authority (FCA).


Tagged , , , , , , ,

Nifty: towards new lows: Breaking Down “Support levels”


Nifty (7215) Target (7115)

Continuing the downward journey, Nifty closed with a loss of 82 points yesterday.  A breakdown below 7240 level dragged it down to 7177 which is its new low in 18 months.  However due to intraday pullback Nifty settled at 7215.  One month chart shows Nifty moving volatile between 7600 on the higher side and 7250-7300 on the lower side.  Yesterday’s move shows a downward breakdown from this range and daily MACD has generated a sell signal.  With yesterday’s move, it has broken down below the lower end support as well as the lower support of the falling channel.  However, despite a new low index, 14 days RSI has failed to do so.

BREAKING DOWN ‘Support levels’

Many traders seek to avoid downtrends because they can drastically affect the value of any investment. A downtrend can last for minutes, days, weeks, months or even years so identifying a downtrend early is very important. Once a downtrend has been established (series of lower peaks) a trader should be very cautious about entering into any new long positions.

Read more: Downtrend Definition Investopedia

Risk Warning
This does not constitute or form part of any offer for sale or subscription or solicitation of any offer to buy or subscribe for any shares nor shall it or any part of it form the basis or be relied on in connection with any contract or commitment whatsoever. Please note that William Albert Securities Limited does not enter into any form of contract by means of internet. William Albert Securities Limited (FCA 230691) is authorised and regulated, in the UK, by the Financial Conduct Authority (FCA).
Tagged , , , , , ,

Tweezer Top for BG Group


FTSE 100 – BG (1009.25)

Image result for tweezer chart pattern

A tweezer top has formed at 1082 in candlestick chart as price resumes to drop.  The position of daily momentum studies are also overbought with major indicators close to giving a sell signal soon.  On trading below 1100 the target comes first at 1000 and thereafter at 950.

BG Group PLC operates as an integrated natural gas company. The Company explores develops, produces, liquefies, and markets hydrocarbons with a focus on natural gas. BG Group extends its services throughout global networks.

Open – 1,030.50

Day Range – 1,025.50-1,038

52WK Range – 808.8-1,300

Market Cap (B GBP) – 35.141

Shares Outstanding (B) – 3.418

Sector – Energy

Industry – Oil, Gas & Coal

Sub-industry – Exploration & Production

DEFINITION of ‘Tweezer’

Tweezer patterns occur when two or more candlesticks touch the same bottom for a tweezer bottom pattern or top for a tweezer top pattern. This type of pattern can be made with candlestick charts of various types.

Read more: Tweezer Definition

Risk Warning
This does not constitute or form part of any offer for sale or subscription or solicitation of any offer to buy or subscribe for any shares nor shall it or any part of it form the basis or be relied on in connection with any contract or commitment whatsoever. Please note that William Albert Securities Limited does not enter into any form of contract by means of internet. William Albert Securities Limited (FCA 230691) is authorised and regulated, in the UK, by the Financial Conduct Authority (FCA).
Tagged , , , , , , , , , , ,

Lloyds Looking Weak


FTSE 100 – Lloyds (LLOY:  59.597) Target (55)

Image result for lloyds bank

The intermediate trend for stock is down as it trends lower top-lower bottom formation.  Stock is trending below 21,50 and 200 days moving average, is also a negative indicator for trend.  Further the position of daily momentum studies are also negative with major indicators trading lower below mid range.  On trading below 65 the target comes first at 56.5 and thereafter at 55.

Lloyds Banking Group plc, through subsidiaries and associated companies, offers a range of banking and financial services. The Company provides retail banking, mortgages, pensions, asset management, insurance services, corporate banking, and treasury services.

Open – 59.07

Day Range – 59.02-60.06

52WK Range – 59.01-89.35

Market Cap (B GBP) – 42.415

Shares Outstanding (B) – 71.374

Sector – Financials

Industry – Banking

Sub-industry – Banks

Risk Warning
This does not constitute or form part of any offer for sale or subscription or solicitation of any offer to buy or subscribe for any shares nor shall it or any part of it form the basis or be relied on in connection with any contract or commitment whatsoever. Please note that William Albert Securities Limited does not enter into any form of contract by means of internet. William Albert Securities Limited (FCA 230691) is authorised and regulated, in the UK, by the Financial Conduct Authority (FCA).


Tagged , , , , , , ,

M&S – Positive Outlook


Marks & Spencer (MKS:Target 450)

Trend is seen gathering support at 400 level forming the under gap portion made during 2014.  Daily momentum position studies are also positive with major indicators trading higher above mid range.  On trading above 403 the target comes first at 435 and thereafter at 450.

Marks & Spencer Group PLC is a holding company. The Company, through its subsidiaries, provides retail of clothing, food and home products.

Open – 418.1

Day Range – 408.5-419.3

52WK Range – 407.1-600

Market Cap (B GBP) – 6.699

Shares Outstanding (B) – 1.626

Sector – Consumer Discretionary

Industry – Retail-discretionary

Sub-industry – Department Stores

Risk Warning
This does not constitute or form part of any offer for sale or subscription or solicitation of any offer to buy or subscribe for any shares nor shall it or any part of it form the basis or be relied on in connection with any contract or commitment whatsoever. Please note that William Albert Securities Limited does not enter into any form of contract by means of internet. William Albert Securities Limited (FCA 230691) is authorised and regulated, in the UK, by the Financial Conduct Authority (FCA).


Tagged , , , , , , , , , ,

Capita Group – intermediate trend has turned down


FTSE 100 – Capita Group (1113) Target (1050)

The intermediate trend has turned down for stock as it trends in lower top lower bottom formation.  Stock trending below the 21, 50 and 200 days moving average is also a negative indicator for trend.  The position of daily momentum studies are also negative with major indicators trading lower below mid range.  On trading below 1150 the target comes first at 1150 the target comes first at 1050 and thereafter at 1000.

Capita PLC provides an integrated range of services across the United Kingdom’s public and private sectors. The Company provides customer services, human resource services, software services, systems and strategic support, and property services.

Open – 1112

Day Range – 1111-1123

52WK Range – 1102-1336

Market Cap (B GBP) – 7.365

Shares Outstanding (M) – 662.355

Sector – Consumer Discretionary

Industry – Commercial Services

Sub-industry – Professional Services

Risk Warning
This does not constitute or form part of any offer for sale or subscription or solicitation of any offer to buy or subscribe for any shares nor shall it or any part of it form the basis or be relied on in connection with any contract or commitment whatsoever. Please note that William Albert Securities Limited does not enter into any form of contract by means of internet. William Albert Securities Limited (FCA 230691) is authorised and regulated, in the UK, by the Financial Conduct Authority (FCA).
Tagged , , , , , , , ,

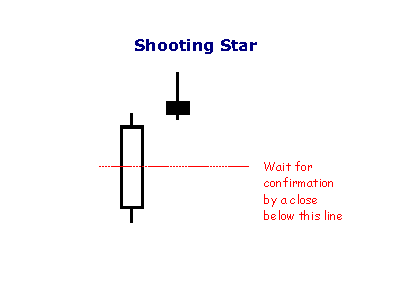
SAGE (SGE:616p) -Shooting Star-indicating trend reversal!


Daily price chart shows a near double top formation in sage while making identical top at 625.  A shooting star in candlestick  chart with a long upper shadow signals trend reversal in the making.  The position of daily momentum studies are also overbought with major indicators close to giving a sell signal soon.  On trading below 625 the target comes first at 595 and thereafter at 585.

The sage Group plc is a software publishing company. The Group develops, publishes and distributes accounting and payroll software for personal computer systems. Via its subsidiaries, Sage also maintains a registered user database which provides a market for their related products and services, including computer forms, software support contracts, program upgrades and training.

  • Open – 622
  • Day Range – 612-623
  • 52WK Range – 458.4-629.5
  • Market Cap (B GBP) – 6.638
  • Shares Outstanding (B) – 1.079
  • Sector – Technology
  • Industry – Software
  • Sub-industry – Application Software

DEFINITION of ‘Shooting Star’

A type of candlestick formation that results when a security’s price, at some point during the day, advances well above the opening price but closes lower than the opening price.

Read more: Shooting Star Definition | Investopedia

Risk Warning
This does not constitute or form part of any offer for sale or subscription or solicitation of any offer to buy or subscribe for any shares nor shall it or any part of it form the basis or be relied on in connection with any contract or commitment whatsoever. Please note that William Albert Securities Limited does not enter into any form of contract by means of internet. William Albert Securities Limited (FCA 230691) is authorised and regulated, in the UK, by the Financial Conduct Authority (FCA).
Tagged , , , , , , , ,

Barclays: In a downtrend?


FTSE 100 – Barclays (BARC:  173) Target (165)

The immediate trend for stock is down as it trends in lower top lower bottom formation.  Stock trending below 21.5 and 200 days moving average is a negative indicator for trend.  On trading below 200 the target comes first at 168 and thereafter at 165.

Barclays PLC is a global financial services provider engaged in retail banking, credit cards, wholesale banking, investment banking, wealth management and investment management services.
Open – 172.3
Day Range – 167.85-172.9
52WK Range – 167.85-289.8
Market Cap (B GBP) – 29.202
Shares Outstanding (B) – 16.807
Sector – Financials
Industry – Banking
Sub-industry – Diversified Banks

Lower Top & Bottom-Technical Analysis

Lower Top
Lower top is a concept used in technical analysis to reflect a downtrend in a stock or index. On the charts, lower tops are characterised by each important high being lower than its previous important high. On observing this on the charts, traders can try to build shorts on every pullback rally or at least avoid building fresh longs.Lower Bottom
Lower bottom is a concept used in technical analysis to reflect a downtrend in a stock or index. On the charts, lower bottoms are characterised by each important low being lower than its previous important low. On observing this on the charts, traders can try to build longs near the lows or avoid building fresh shorts near the lows.

Risk Warning
This does not constitute or form part of any offer for sale or subscription or solicitation of any offer to buy or subscribe for any shares nor shall it or any part of it form the basis or be relied on in connection with any contract or commitment whatsoever. Please note that William Albert Securities Limited does not enter into any form of contract by means of internet. William Albert Securities Limited (FCA 230691) is authorised and regulated, in the UK, by the Financial Conduct Authority (FCA).
Tagged , , , , , , , , , ,