Daily price chart shows a near double top formation in sage while making identical top at 625. A shooting star in candlestick chart with a long upper shadow signals trend reversal in the making. The position of daily momentum studies are also overbought with major indicators close to giving a sell signal soon. On trading below 625 the target comes first at 595 and thereafter at 585.
The sage Group plc is a software publishing company. The Group develops, publishes and distributes accounting and payroll software for personal computer systems. Via its subsidiaries, Sage also maintains a registered user database which provides a market for their related products and services, including computer forms, software support contracts, program upgrades and training.
- Open – 622
- Day Range – 612-623
- 52WK Range – 458.4-629.5
- Market Cap (B GBP) – 6.638
- Shares Outstanding (B) – 1.079
- Sector – Technology
- Industry – Software
- Sub-industry – Application Software
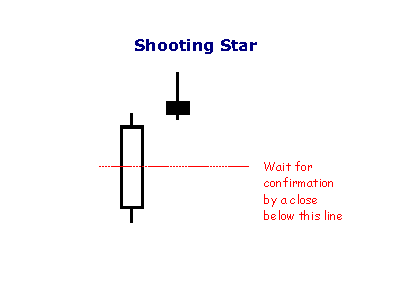
DEFINITION of ‘Shooting Star’
A type of candlestick formation that results when a security’s price, at some point during the day, advances well above the opening price but closes lower than the opening price.
Read more: Shooting Star Definition | Investopedia
